Module 2: Security Monitoring & SIEM Fundamentals
Security monitoring is the operational heartbeat of a SOC: the constant cycle of detecting, assessing, and responding to threats. At the center of that cycle sits the Security Information and Event Management (SIEM) platform, which combines two historical capabilities:
- Security Information Management (SIM): Long-term log collection, storage, and compliance reporting.
- Security Event Management (SEM): Real-time event correlation and alerting.
A modern SIEM can be augmented with AI, and many already are, but it is not a magic detector. Strong monitoring and less alert fatigue still depend on good data ingestion, consistent schemas, thoughtful detection logic, and disciplined analyst workflows. It also depends on people actually using that technology.

Regardless of tech evolution, SIEM matters
Operating without a SIEM leaves an organization blind. Without centralized visibility and correlation across endpoints, servers, and network devices, defenders are left with a graveyard of disconnected logs. The SIEM is what turns raw telemetry into actionable incidents.
Understanding the architecture matters, and this module focused on the Elastic Stack.
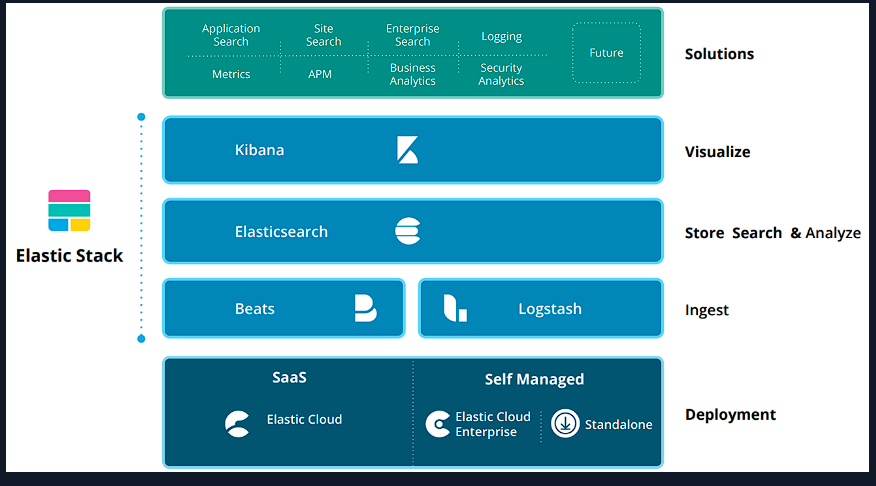
The Elastic Stack (ELK)
The Elastic Stack is a common baseline for transforming raw logs into searchable intelligence.
- Elasticsearch: Distributed search and storage engine for log data.
- Logstash: Ingests, parses, and normalizes logs before indexing.
- Kibana: Search and visualization interface for analysts.
- Beats: Lightweight shippers installed on hosts (e.g., Winlogbeat for Windows logs).
Why Beats matter: They keep the collection footprint small so visibility does not disrupt production systems.
The Language of Analysis: ECS and KQL
Elastic Common Schema (ECS) provides a shared vocabulary so fields remain consistent across log sources (for example, user.name means the same thing everywhere).
Kibana Query Language (KQL) is used to search and filter the data. A critical distinction:
- Standard fields (e.g.,
user.name): Best for searches and free-text queries. - Keyword fields (e.g.,
user.name.keyword): Required for aggregations, tables, and sorting.
Practical KQL examples:
event.code:4625(failed logons)event.code:4625 AND user.name:admin*(failed logons for admin-like users)@timestamp >= "2023-03-03T00:00:00.000Z"(time-range filter)NOT user.name:*$(exclude computer accounts that end with$)
People and Process: SOC Tiering
Technology only works when the right people follow the right processes. A typical SOC structure looks like this:
| Role | Primary Responsibilities |
|---|---|
| Tier 1 Analyst | First responders: monitor alerts, triage, and prioritize incidents. |
| Tier 2 Analyst | Deep analysis, pattern identification, and mitigation strategies. |
| Tier 3 Analyst | Complex incidents, proactive threat hunting, advanced forensics. |
| SOC Manager | Oversees daily operations and cross-team coordination. |
| Detection Engineer | Builds and maintains detection rules and coverage. |
Exact roles vary by organization size, but the tiered model keeps response efficient.
The Ideal Triage Workflow
A disciplined triage process prevents alert fatigue and supports consistent decisions. A common 12-step workflow:
- Initial review: Metadata, timestamps, hostnames, IPs.
- Classification: Severity and urgency.
- Correlation: Related events and indicators.
- Enrichment: Threat intel, sandbox, PCAP, context.
- Risk assessment: Impact on critical assets and data.
- Contextual analysis: Controls, baselines, compliance posture.
- Response planning: Containment and recovery steps.
- Consultation: Coordinate with system owners or IT.
- Response execution: Take action based on findings.
- Escalation: Move to higher tiers when needed.
- Continuous monitoring: Track follow-up events.
- De-escalation: Document lessons learned and close the case.
A useful mental model is review → correlate → confirm → assess impact → consult → respond → document → monitor.
Threat-Informed Monitoring with MITRE ATT&CK
MITRE ATT&CK is still central to building useful visibility.
Effective monitoring is threat-informed. MITRE ATT&CK maps adversary behavior into:
- Tactics: The attacker’s objective (the “what”).
- Techniques: The method used (the “how”).
SOCs use ATT&CK for detection engineering, gap analysis, and threat intelligence enrichment. Mapping detections to ATT&CK ensures alerts are tied to real adversary behavior, not just random noise.
The Detection Engineering Use Case Lifecycle
Alerts do not appear by accident. A strong detection follows a lifecycle:
- Requirements: Define the exact scenario to detect.
- Data points: Identify needed logs (Windows, Linux, network, etc.).
- Log validation: Ensure required fields exist.
- Design: Build the logic (e.g., “10 failures in 4 minutes”).
- Implementation: Translate into SIEM rules or queries.
- Documentation: Write SOPs for analyst response.
- Testing: Validate coverage and correctness.
- Fine-tuning: Reduce false positives.
Important: The best detections bridge technical telemetry with business impact, so the SOC can prioritize what truly matters.
One use case from the lab:
Practical Use Case: MSBuild
MSBuild.exe is a trusted developer utility, but it can be abused as a living-off-the-land binary (LoLBin).
- Scenario A (High severity): MSBuild started by Office apps (Word/Excel). Strong indicator of malicious execution.
- Scenario B (Medium severity): MSBuild making outbound network connections. Suspicious, but may be legitimate developer activity.
Detection spotlight (MITRE mapping):
- Tactics: Defense Evasion (TA0005), Execution (TA0002)
- Technique: Trusted Developer Utilities Proxy Execution (T1127)
- Sub-technique: MSBuild (T1127.001)
Context is everything. Parent process and environment baseline determine severity.
High-Impact Visualizations
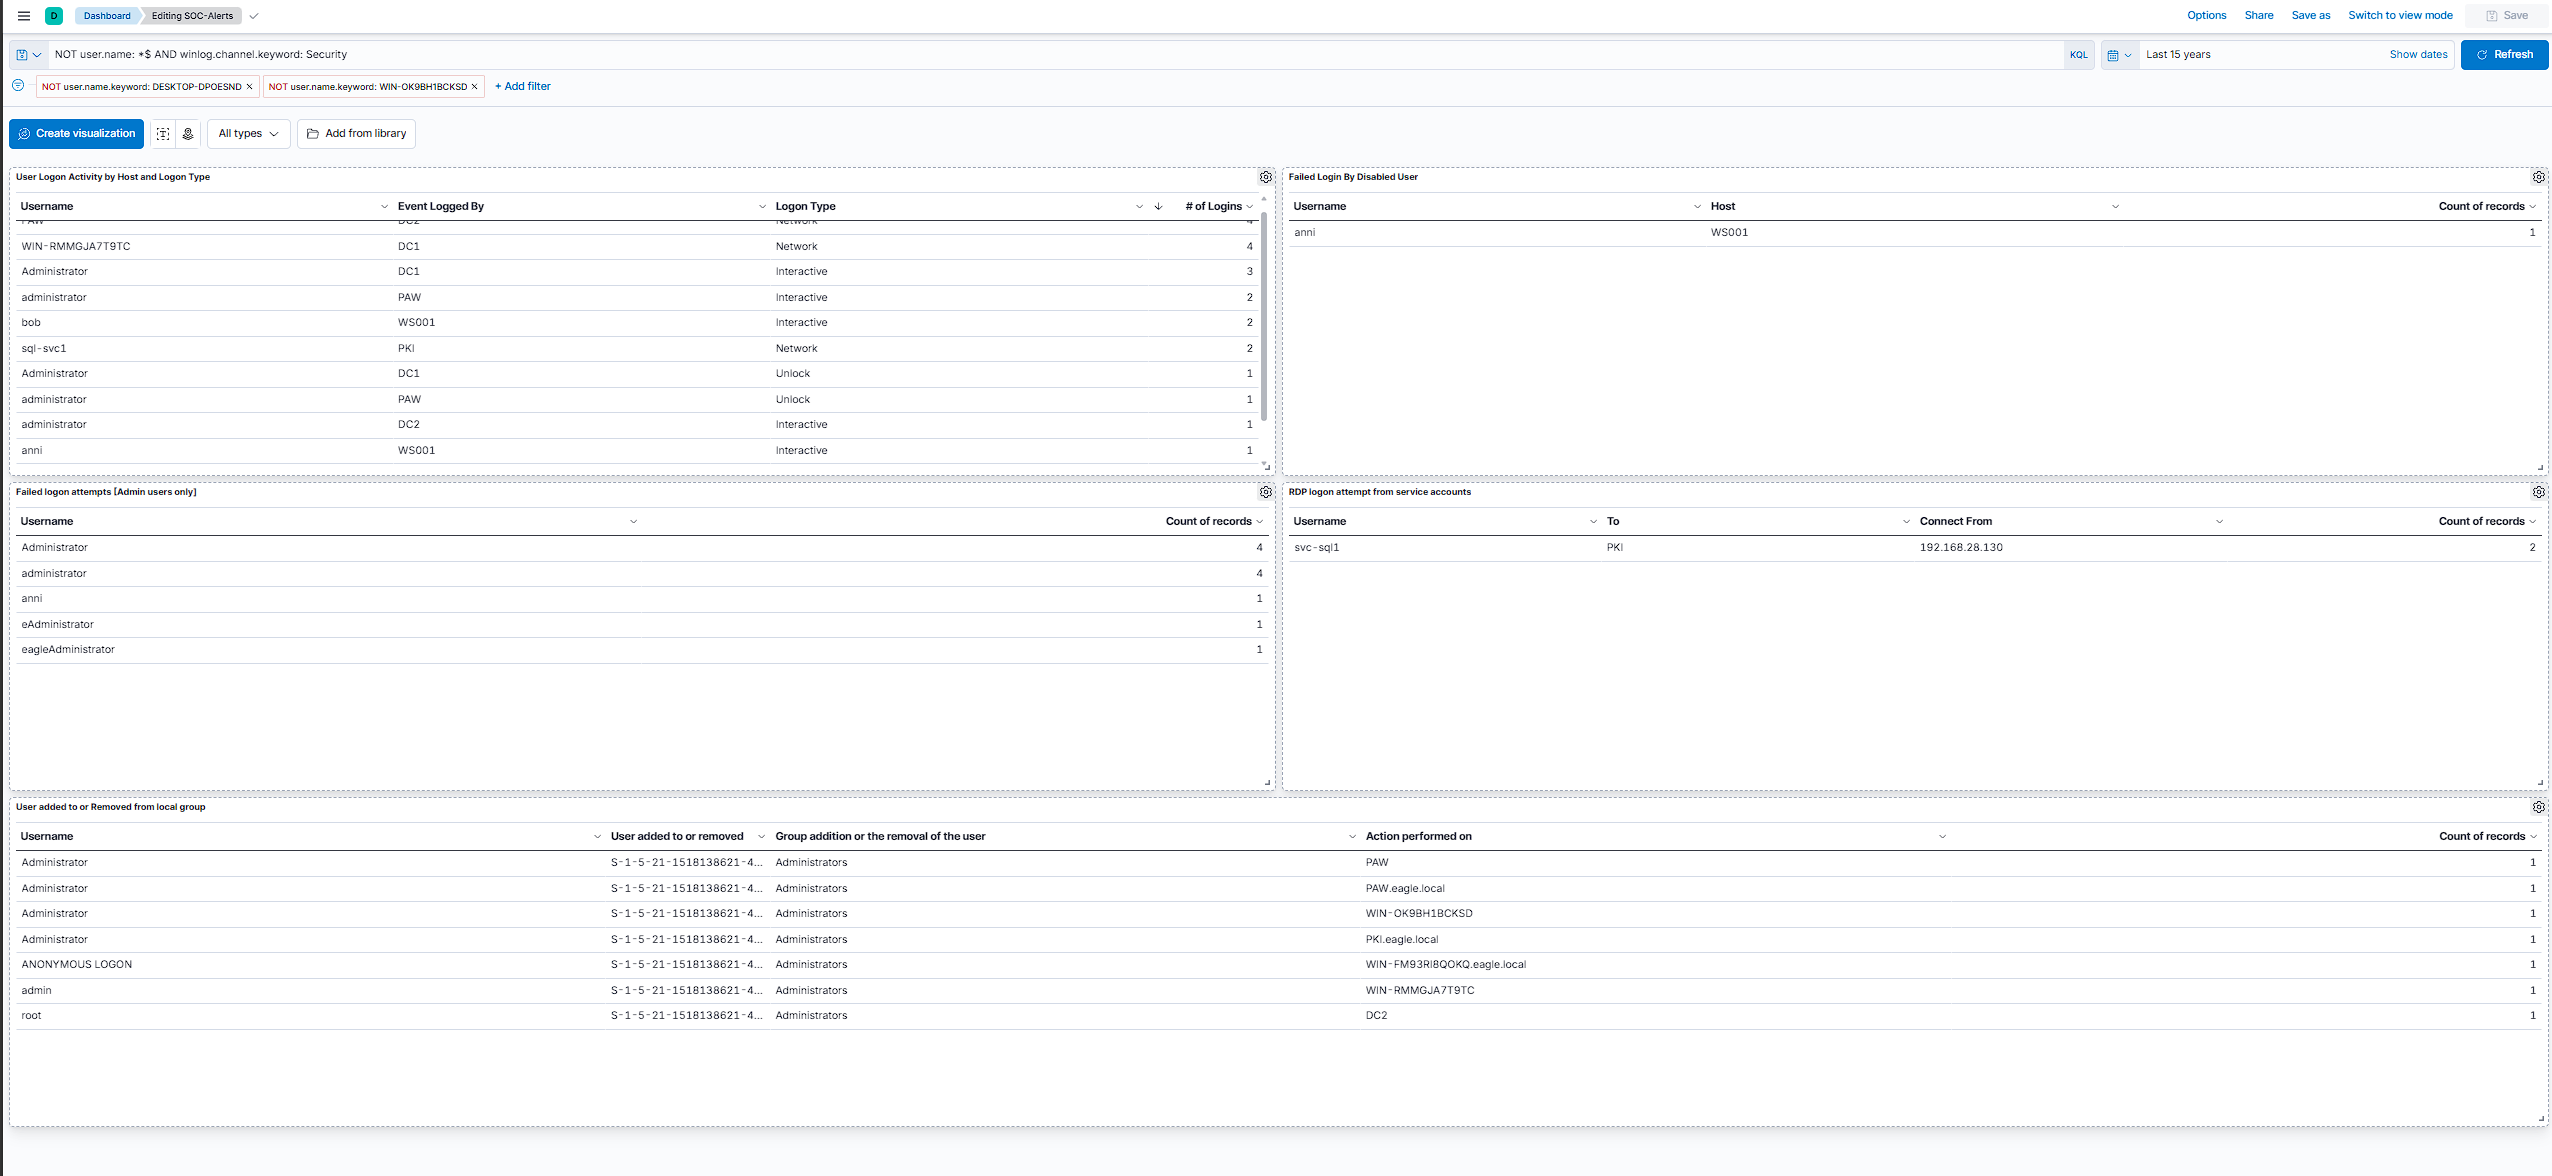
The lab built toward a SOC-Alerts dashboard in Kibana. The base query was NOT user.name: *$ AND winlog.channel.keyword: Security, which filters out computer accounts and keeps the view on Security channel events. Simple filter, but it made the data much easier to work with.
The dashboard had five panels:
User Logon Activity by Host and Logon Type
Successful logons grouped by user, host, and logon type. This is baseline context before you start chasing alerts. You can see normal interactive logons from users like bob and anni on WS001, network logons to domain controllers, and service accounts like svc-sql1 reaching PKI. Knowing what normal looks like matters when something breaks pattern later.
Failed Login By Disabled User
Event ID 4625 with SubStatus 0xC0000072 means someone tried a valid password on a disabled account. In the dashboard, user anni showed up against WS001. That is a high-fidelity signal that stolen credentials may be in play.
Failed logon attempts [Admin users only]
Failed logons filtered down to admin-like accounts. The lab showed attempts against Administrator, administrator, and variations like adminstrator and eagle\administrator. Same event type, different username targets. Useful for spotting spray or brute-force activity aimed at privileged accounts.
RDP logon attempt from service accounts
Service accounts should not be RDPing into hosts. Here, svc-sql1 connected to PKI from 192.168.28.130. The pattern is Event ID 4624 with Logon Type 10 (RemoteInteractive) on svc-* accounts.
User added to or Removed from local group
Local group membership changes. Most entries were the Administrator account being added to the local Administrators group across hosts like PAW, PKI.eagle.local, and WIN-OK9BH1BCKSD. The one that stood out was an ANONYMOUS LOGON making the same change on WIN-FM93RI8QOKQ.eagle.local. That is not normal activity.
Example logic from the module:
event.code:4625 AND winlog.event_data.SubStatus:"0xC0000072"event.code:4624 AND winlog.event_data.LogonType:10 AND user.name:svc-*
The dashboard:
Skills Assessment
The module ended with a Dashboard Review & Critical Thinking exercise: you onboard as a SOC Tier 1 analyst at Eagle, read the senior analyst’s environment notes, then work through the SOC-Alerts dashboard and decide what is noise vs what needs escalation or a check with IT ops. Pretty cool .
Same idea as the panels above, but now with context: PAW-only admin work, -svc service account naming, disabled user anni trying to log in, suspicious svc-sql1 RDP activity, local group changes, admin logons outside PAW, and SSH logins against what the environment actually allows.
Where AI Can Help
Beyond the module content itself, I wanted to add how this connects to where SOC tooling is heading.
What the platforms already do
Honest note: I haven’t deployed these tools myself yet. I’m learning where the field is heading, because the direction matters as much as the fundamentals.
After seeing how a SOC monitors, triages, and builds detections, the next question is where AI fits. The industry has shifted toward the agentic SOC: AI agents that absorb repetitive, high-volume work at machine speed. Microsoft describes triage, correlation, and basic investigation getting handled by the system so analysts focus on higher-impact decisions, with agents automating 75% of phishing and malware investigations in their own environments [Microsoft]. Mapped to the 12-step triage workflow, that’s mostly steps 1-4: review, classify, correlate, enrich. On the detection side, the standard is now detection-as-code with Sigma, a vendor-neutral rule format that converts to KQL, SPL, and many others, with ATT&CK tags built into each rule [SigmaHQ]. Beyond the big platforms, a wave of dedicated agentic-SOC startups has emerged recently: Dropzone, Prophet, Simbian, Radiant, and others, all building AI analysts that triage and investigate autonomously [Gartner].
That said, this is the big-vendor, best-case view. Most organizations aren’t there. Plenty still run manual SOCs fighting basic log coverage and alert fatigue, gated by cost, talent, and data maturity. So the agentic SOC is a direction, not most teams’ reality, which is exactly why these fundamentals still matter.
That leads to the part that matters more practically: regardless of whether a company can afford agentic tooling, the analyst can still leverage AI on their own. You don’t need a million-dollar platform to have AI draft a KQL query, convert a Sigma rule, or summarize a messy log. The leverage is available to anyone. The difference is the skill of the person using it. AI is a multiplier on judgment you already have, not a substitute for judgment you don’t.
Even where AI handles a step, you still have to understand it well enough to check it. The parts that stay human are the ones this whole module keeps circling back to: setting severity in context (MSBuild is High from Office, Medium on a network connection; that’s a baseline call, not a rule), judging business impact (which asset actually matters), reading high-fidelity signals (why 0xC0000072 on a disabled account or an svc-* RDP logon stands out), and deciding what to whitelist. AI can draft all of these; only the analyst can confirm them.
For my own faster triage and SIEM use case development, I’ll use AI (Claude Skills, Claude Code, similar features) in future for the buildable parts: take a scenario, draft the detection logic as KQL or Sigma, move faster. But implementation, testing, and tuning I’m doing by hand, not because AI can’t, but because doing it manually is how I learn it, and that understanding is what lets me verify the AI instead of trusting it blindly.
The takeaway: AI compresses the analyst’s time; it never replaces the analyst’s judgment. Contextualization stays human. Whether your org runs a fully agentic SOC or a spreadsheet and a SIEM, the analyst who pairs their own skillset with AI is the one who scales. Analyst-in-the-loop is the practical baseline, not an optional extra.
Final Takeaway
Security monitoring is not just about tools. It is a discipline that combines reliable telemetry, clean schemas, detection engineering, and structured analyst workflows. A SIEM can only be as strong as the data, logic, and people behind it.
References
[Gartner] Hype Cycle for Security Operations, 2025, Gartner (June 23, 2025). Note: the report itself sits behind Gartner’s paywall; it’s most accessible via vendor summaries that cite it (e.g. Dropzone’s published breakdown). https://www.gartner.com/en/documents/6628302
[Microsoft] The Agentic SOC: Rethinking SecOps for the Next Decade, Microsoft Security Blog (April 9, 2026); Security Copilot for SOC: Bringing Agentic AI to Every Defender, Microsoft Community Hub (2026). https://www.microsoft.com/en-us/security/blog/2026/04/09/the-agentic-soc-rethinking-secops-for-the-next-decade/ · https://techcommunity.microsoft.com/blog/microsoftthreatprotectionblog/security-copilot-for-soc-bringing-agentic-ai-to-every-defender/4470187
[Copilot Use Cases] Copilot for Security: Practical Use Cases (May 27, 2026). https://arnav.au/2026/05/27/copilot-for-security-practical-use-cases/
[SigmaHQ] SigmaHQ: Generic Signature Format for SIEM Systems (official repository). https://github.com/SigmaHQ/sigma
[Sigma/TheHGTech] Sigma Rules for SIEM Detection: Complete Guide [2026] (January 9, 2026). https://thehgtech.com/guides/sigma-rules-siem-detection.html
[Sigma/Ridgeline] Sigma Rules for Detection Engineers (2026). https://ridgelinecyber.com/training/courses/sigma-rules/
[Elastic] Elastic Stack Overview. https://www.elastic.co/elastic-stack/
[ECS] Elastic Common Schema (ECS). https://www.elastic.co/guide/en/ecs/current/index.html
[KQL] Kibana Query Language (KQL). https://www.elastic.co/guide/en/kibana/current/kuery-query.html
[MITRE ATT&CK] MITRE ATT&CK Framework. https://attack.mitre.org/